
See how your database fits together without drawing every table and relationship by hand. Whether you’re finding your way around an unfamiliar codebase or explaining the schema to a teammate, a clear ER diagram gives you a picture to work from. Claude or Codex can help you build one from the SQL you already have.
This guide takes you from a copy-and-paste prompt to a visual diagram you can open in your browser and share with your team. Start with a complete worked example, then refine the layout, add zoom and pan, and update the diagram when your schema changes. Along the way, you’ll learn how to check that the AI’s output matches your database.
The examples on this page were generated by pasting the prompt and SQL into Claude Code and Codex, with the assistant saving the HTML file directly. The same prompts should work in the Claude or ChatGPT chat apps, but we haven’t tested them there. If the chat app renders the HTML as a preview instead of giving you the file, ask for it as a download.
1. Prepare your schema.sql
Your AI needs the structure of your database: table names, columns, and constraints. If you already have a schema.sql file, you’re ready. Otherwise, export the structure from your database client, or use the schema and migrations in your codebase. You don’t need application rows.
Choose your database below for export instructions and a complete example. Each version describes the same project tracker: four tables, four foreign keys, and tasks that can be unassigned.
The rest of this walkthrough uses the PostgreSQL example. To use another version, replace the SQL in the prompt and name your database engine.
project_members joins users to projects. Its two foreign keys double as a composite primary key, so a user can join a project once. IDs are plain bigints the application assigns.
2. Generate the ERD with a prompt
Start a new conversation and paste the prompt below. For your own database, swap the SQL at the end and change “PostgreSQL” to your engine.
Turn the PostgreSQL schema below into a finished visual ER diagram.
Return one complete HTML file in a single code block. I will save it as erd.html
and open it directly in my browser. No install, build step or internet connection.
Use readable table cards, inline CSS and inline SVG relationship connectors.
Give it a warm off-white background, dark text and muted green table headers.
Show every table and column with its exact name and SQL type, plus PK, FK and
unique markers. Explain composite keys without implying each column is unique.
Label each relationship with its foreign-key column and cardinality at both ends.
Derive cardinality from foreign keys, nullability and uniqueness. Include only
declared foreign keys; do not infer links from column names or redesign the schema.
Keep connectors outside the cards and make the whole diagram fit on a laptop screen.
On narrow screens, allow the whole diagram to scroll without disconnecting lines.
Include a text relationship list and a small legend beneath the diagram.
Keep all CSS and SVG inside the file. No JavaScript, external assets or libraries.
List any limitations after the code block.
-- PostgreSQL. A small project tracker, with no application data.
CREATE TABLE users (
    id bigint PRIMARY KEY,
    email varchar(255) NOT NULL UNIQUE
);

CREATE TABLE projects (
    id bigint PRIMARY KEY,
    name varchar(120) NOT NULL
);

CREATE TABLE project_members (
    project_id bigint NOT NULL REFERENCES projects(id),
    user_id bigint NOT NULL REFERENCES users(id),
    role varchar(20) NOT NULL,
    PRIMARY KEY (project_id, user_id)
);

CREATE TABLE tasks (
    id bigint PRIMARY KEY,
    project_id bigint NOT NULL REFERENCES projects(id),
    assignee_id bigint REFERENCES users(id),
    title varchar(200) NOT NULL,
    external_ticket_id varchar(80)
);

COMMENT ON COLUMN tasks.external_ticket_id IS
    'An identifier from an external issue tracker, not a local foreign key.';
The output is one file containing the diagram’s layout, styling, and connections. The prompt asks for table cards and SVG lines, which the browser can render directly. It also asks for a text relationship list, so the meaning remains readable even if a line is awkwardly placed.
Save the result as erd.html, whether it came as a download or a code block, and open it in your browser.
All four drew the same four relationships and left external_ticket_id unconnected. What differs is the layout, the cardinality notation and the wording of the relationship list.
If something looks wrong
- Raw code in the browser. The file saved as
.txt. Rename it. - Cards collide, or a line crosses a label. That is layout, not schema. Send the assistant a screenshot and ask for a layout-only fix that leaves every relationship as it is.
Why a single file? It has no external dependencies, so you can open it anywhere and send it to a teammate as it is. You can keep refining it in the same conversation. Next, we’ll tailor the layout and level of detail, then cover how to update it as your schema changes.
3. Refine your diagram
You now have an ER diagram you can open and share. Use follow-up prompts to make it easier to read: arrange the tables around a workflow, simplify the detail for a walkthrough, or highlight the relationships you want to discuss.
Continue in the same conversation so the assistant has your schema and generated HTML. In a chat interface, ask for the complete updated file and save it again. In Claude Code or Codex, ask it to edit the file directly.
Arrange the tables around your workflow
Tell the assistant where you want the tables and which connections should be easiest to follow. A screenshot helps when you want to point out a crowded area.
Update the layout of erd.html.
Place projects on the left, tasks in the center and users on the right.
Place project_members below projects and users.
Route connectors through the gaps between cards and keep labels clear of lines.
Keep every table, column, key and relationship unchanged.
Keep the same self-contained HTML format.
Choose how much detail to show
Keep all columns visible when you’re working on the schema. For a team walkthrough, a view with just the keys and a few descriptive fields is easier to follow. Create a separate overview so you can keep both:
Create assignment-overview.html from erd.html.
Include tasks, users, projects and project_members.
Show primary keys, foreign keys and the task title; hide the other columns.
Keep all four relationships and their original cardinalities.
List the hidden columns below the diagram so readers know this is an overview.
Keep erd.html unchanged. Keep the same self-contained HTML format.
For a larger database, ask for a separate view of one area, such as billing or permissions. Name the tables you want included and ask the assistant to list any relationships that lead to tables outside that view.
Highlight the relationships you want to explain
When you’re walking someone through task assignment, make the assignee connection stand out. Keep the rest of the diagram visible so they can see how it fits into the schema.
In erd.html, highlight the connection from tasks.assignee_id to users.id.
Use a thicker line and an accent color, and label it 'Assignee'.
Keep the other relationships visible in a muted color with readable labels.
Add a short note: a task can be unassigned or assigned to one user;
a user can be assigned many tasks.
Keep the layout, columns, keys and relationship cardinalities unchanged.
Keep the same self-contained HTML format.
Open the result and resize the browser. Labels should stay readable and connectors should stay attached to their cards.
Then compare it with your SQL before you share it. Refinements change how the diagram looks, not what it claims, so the table and connection counts should not move. This example has four tables and four foreign-key connections.
4. Add interaction and updates
Once the static diagram is accurate, add controls that help you explore it. Zoom and pan are useful for a growing schema, provided the cards and connectors move together. Keep a reset button and keyboard-accessible controls so readers can recover the initial view.
We’ll also make one schema change: tasks can have an optional reviewer as well as an assignee. The sample includes this migration:
-- Apply after schema.sql, in a disposable tutorial database.
ALTER TABLE tasks ADD COLUMN reviewer_id bigint REFERENCES users(id);
You do not need to run it. For the walkthrough, tell the assistant the migration is applied. In your own project, tell it what actually is, because that is the one fact it cannot work out from the files. Continue in the conversation that created erd.html. In chat, attach the HTML and the migration with the prompt below. In Claude Code or Codex, keep erd.html, schema.sql, and add-reviewer.sql in the working folder:
The migration in add-reviewer.sql is now applied after schema.sql.
Update erd.html to show the resulting database, preserving the existing design.
Keep all table and column names. Check whether the assignee relationship changes.
Label the reviewer and assignee separately; their lines must not overlap.
Add zoom in, zoom out, reset and drag-to-pan controls using inline JavaScript.
Zoom and pan the cards and connectors together, with a usable initial fit.
Keep keyboard-accessible controls and the text relationship list.
Keep the file self-contained and usable offline. No dependencies or network calls.
Do not modify the SQL files. Explain the diagram changes and anything uncertain.
You get one new nullable column and one new line. Reviewer and assignee both run from tasks to users, so the two lines need separate labels and must not sit on top of each other. Check the assignee line survived the update.
Commit the HTML next to your schema and review its diff with the migration. Note the schema source and revision inside the file, because it has no live connection to your database and goes stale the moment someone forgets.
That is the loop. Generate, refine, regenerate when the schema moves. The diagram is only ever as current as the last time you ran it.
Want it in Markdown instead?
Swap the HTML instructions in the prompt for a Mermaid erDiagram. It renders in GitHub and most wikis, or paste it into Mermaid Live Editor. The download includes a reviewed Mermaid version of the baseline schema.
Going further
5. Make it a document you keep
The file you have is a snapshot. You moved those tables by describing them in a prompt and regenerating the whole file. On a canvas you drag the table, edit the column, and your team works on the same diagram instead of passing new files around.
You can do that in DrawSQL by importing the same schema.sql. Here’s our four-table project tracker in the editor:
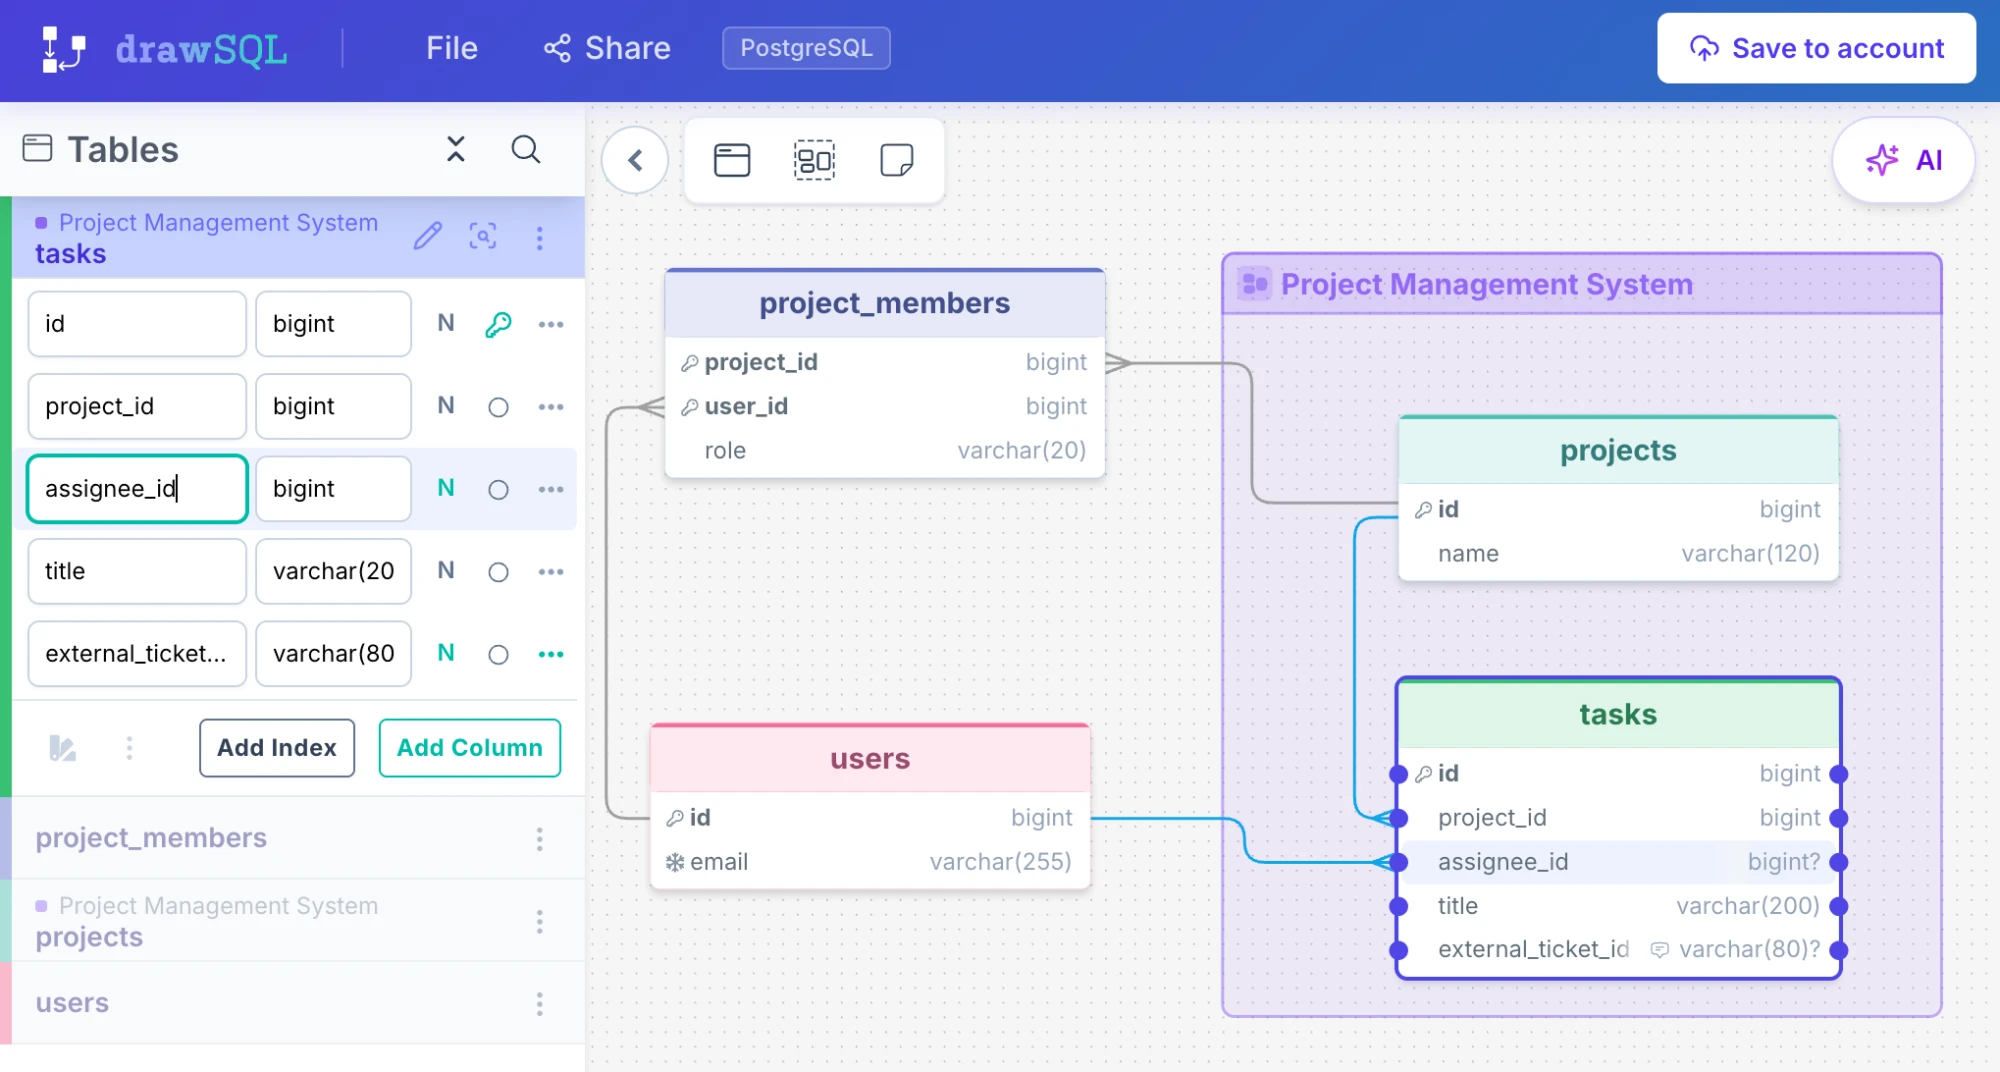
Drag tables to arrange the layout, edit columns directly, and collaborate with teammates in real time. Import your original schema.sql so all columns and constraints are included, even if you hid some in the simplified overview.
Using Claude Code or Codex? Connect the DrawSQL MCP server and ask your assistant to create a diagram from schema.sql using visualize_schema.
Or skip the HTML file altogether: ask your AI to return the schema as a DrawSQL link, and open the diagram straight from the chat.